
I’ll help you find your way through this overwhelming sea of data with mySugr’s analysis feature. Ready?
I admit, data is not a friend of mine. We don’t get along. I’m not a data-person. A perfect match for diabetes, right? Nevertheless, evaluating our diabetes-related data is super important for us, because we can learn a lot from it and improve our therapy.
Introducing mySugr’s analysis feature
The answer is just a few “swipes” away. To get into the analysis, simply swipe left on your home screen. Now you can see your averages for the last 7 days on the first screen. Keep swiping to see 14, 30 and 90 days.Ready for an example?
Let’s take a look at the 90 days / quarterly analysis. This is my personal favorite and is really helpful when I’m sitting in the doctor’s office.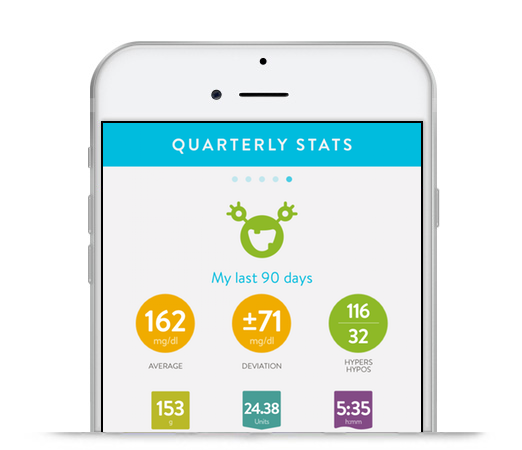
Displayed here we have:
- your diabetes monster
- time period
- BG average
- standard deviation
- number of hypers and hypos (according to your targets)
- average carbs per day
- average bolus insulin per day
- total amount of activity
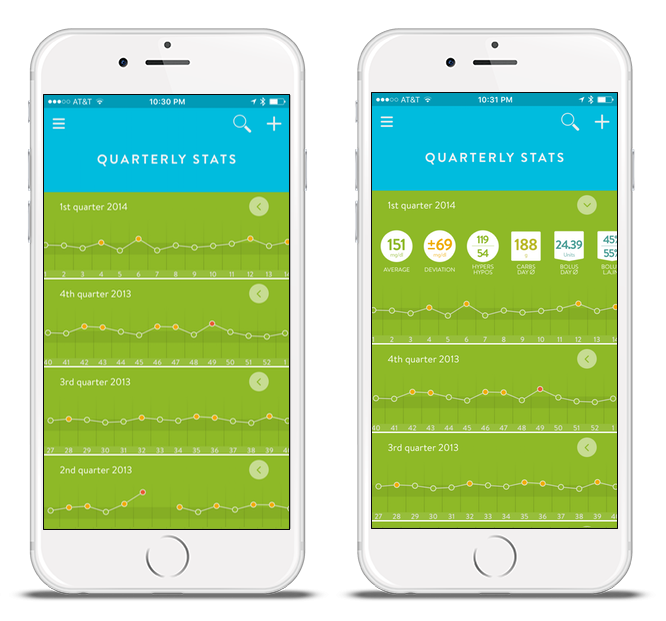
In the quarterly analysis, the dots on the graph represent your weekly average. You’re already used to the color coding and know that if the average is in your target, the dot is green.
Looks nice, but are there also numbers?
Sure, of course. Do you see that intriguing little arrow on the top right of each graph segment? Do you have any guesses what happens when you tap on one? Give it a try! Here are all of the stats for that block. You’ll also find the ratio of bolus/basal (or long-acting) insulin and the ratio of food versus correction insulin. These ratios can help you decide if you need to troubleshoot your basal rates or look for patterns where you might be correcting highs a lot. I can also drag the graphs up and down to compare each quarter to the last. Notice how the top row of stats “stick” so that it’s easy to compare? The same principles apply to the 7, 14, or 30-day analysis. Simple, quick and clear.Are you missing anything?
Tell us in a comment, have you played with the analysis? What do you love? What parts do you use most, and how? What are you missing?The mySugr website does not provide medical or legal advice. mySugr blog articles are not scientific articles, but intended for informational purposes only.
Medical or nutritional information on the mySugr website is not intended to replace professional medical advice, diagnosis or treatment. Always consult a physician or health care provider with any questions you may have regarding a medical condition.

About Anne Kainz
Anne-Sophie Kainz is Head of Customer Support at mySugr. She has been part of mySugr since 2014, yet tackling life with diabetes for over 17 years. Apart from taming the diabetes monster and writing for our blog (e.g. 3 Reasons Why Diabetes Makes You Awesome), you’ll find her outdoors with her lovely dog, Alfie, or in her garden harvesting veggies. On rainy days, she likes to kick back with Netflix and practice her hand lettering and calligraphy skills.